Wireless Incubation Sensor – Data
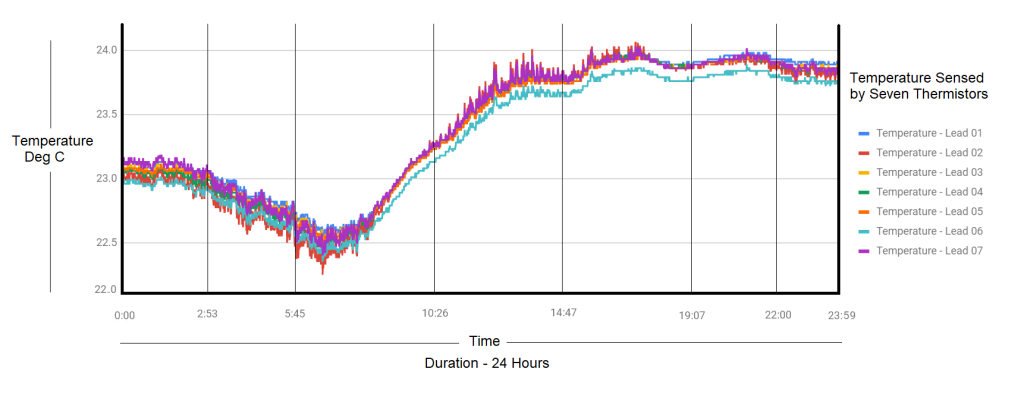
The graph above shows the ambient temperature measured by seven thermistors on a single sensor egg. Note that the temperature readings are very close to each other as should be because they are all close to each other and measuring the ambient temperature.
The data for this graph was downloaded from the WiSense cloud resident data collection and visualization platform.
The setup has one sensor egg (with seven thermistors) sending data to the cloud (via a WiSense gateway) periodically every 30 seconds. Total of 2880 sensor data messages were sent over a period of 24 hours. Each sensor data message also conveys the voltage of the Li-Ion battery inside the sensor egg.
.

Starting Battery Voltage: 3.94V. Battery Voltage after 24 hours: 3.93V
After sending 86400/30 = 2880 messages, the battery voltage has dropped by only 0.01 V.
.
For information on WiSense products, please visit wisense.in.
Posted on January 18, 2021, in Uncategorized. Bookmark the permalink. Leave a comment.

Leave a comment
Comments 0